Monitoring Your Prostation
Steps to monitor
To monitor your workstation’s usage, performance, and billing details, follow these steps within the Billing & Usage section of the Spark Cloud Studio dashboard.
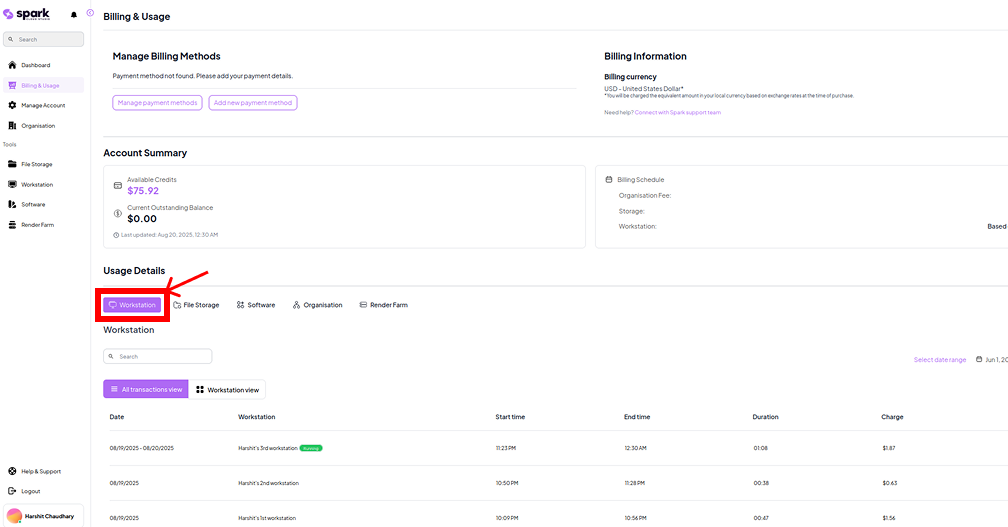
Navigate to the left sidebar of the dashboard and click on the Billing & Usage tab.

Under the Usage Details section, click on the Workstation tab to view usage data specifically related to workstations.
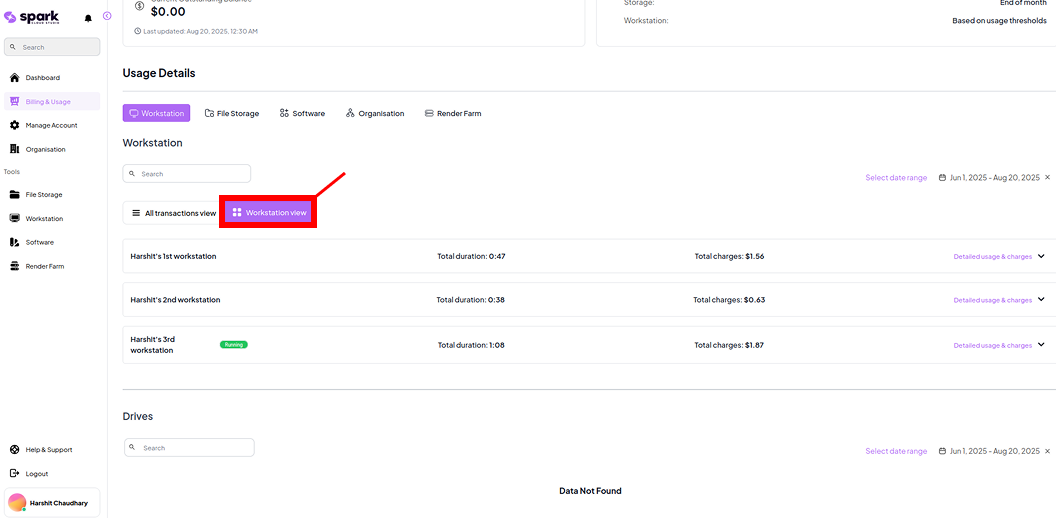
Click the Workstation View button to get a grouped and summarized view of workstation usage and charges.
You can also expand the section by clicking Detailed usage & charges for an itemized breakdown.
Key Features in the Monitoring Panel
| Feature | Description | Screenshot |
|---|---|---|
| Search | Use the search bar to quickly locate a specific workstation by name among multiple entries. | 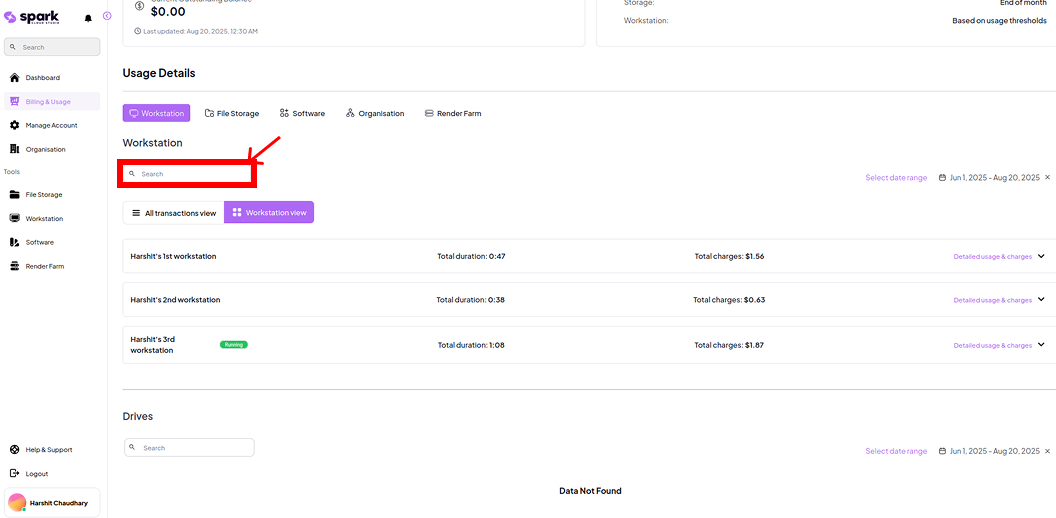 |
| Select Date Range | Filters workstation usage data based on the selected time frame, allowing for custom billing analysis. | 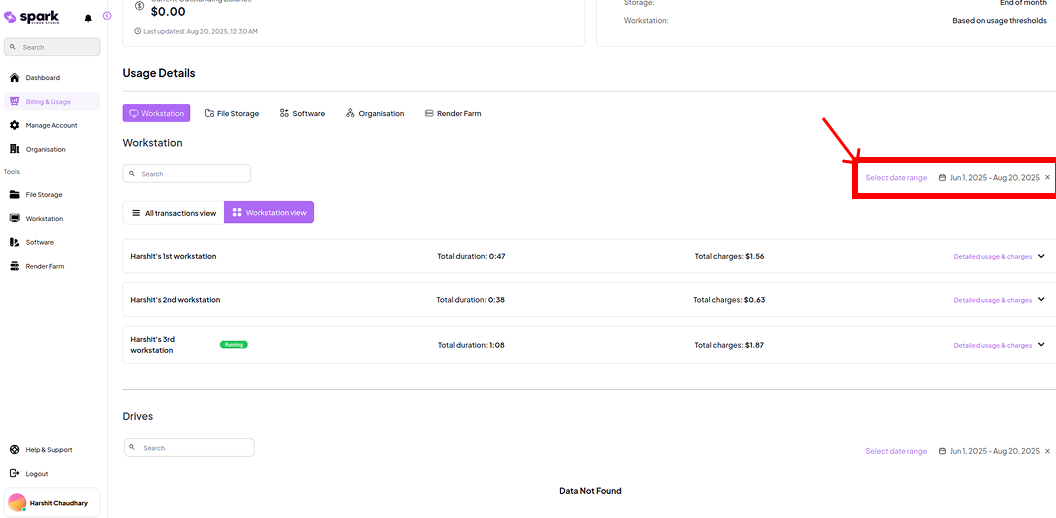 |
Status Indicators
These tags help you understand the current or historical state of your workstation usage at a glance.
| Status | Description | Screenshot |
|---|---|---|
| Running | Indicates that the workstation is currently active and incurring charges. |  |

To learn more about Workstation Billing&Usage, head over to the Prostation Billing & Usage section..